Kubova
A good container fill rate for light cargo is roughly the high-80s to low-90s percent of inner volume; cubes and cartons that tile badly land in the mid-70s to low-80s. Measured in a 40 HC: a mixed 3-SKU load 93.1%, a 50×40×30 cm carton 90.4%, a 40 cm cube 75.5%, and the best single carton (40×30×25 cm) 97.0%. A plan claiming 100% is a red flag. On dense cargo, judge weight use instead.
"Is 82% a good fill rate?" cannot be answered without knowing what you ship. Below are eight measured benchmarks from our packing engine, the formula to compute your own number on the same basis, the geometry behind the spread, and how to read a low number before you decide to re-plan or re-book.
The benchmark: measured fill rates in a 40 HC
We loaded a single 40 HC to capacity with each cargo profile, using light unit weights so that only volume could stop the load. Every figure is a direct engine output.
| Cargo profile (cm) | Carton volume | Volume used |
|---|---|---|
| 40 × 30 × 25 carton | 0.030 m³ | 97.0% |
| Mixed 3-SKU: 60×40×30, 50×50×50, 40×30×20 | mixed | 93.1% |
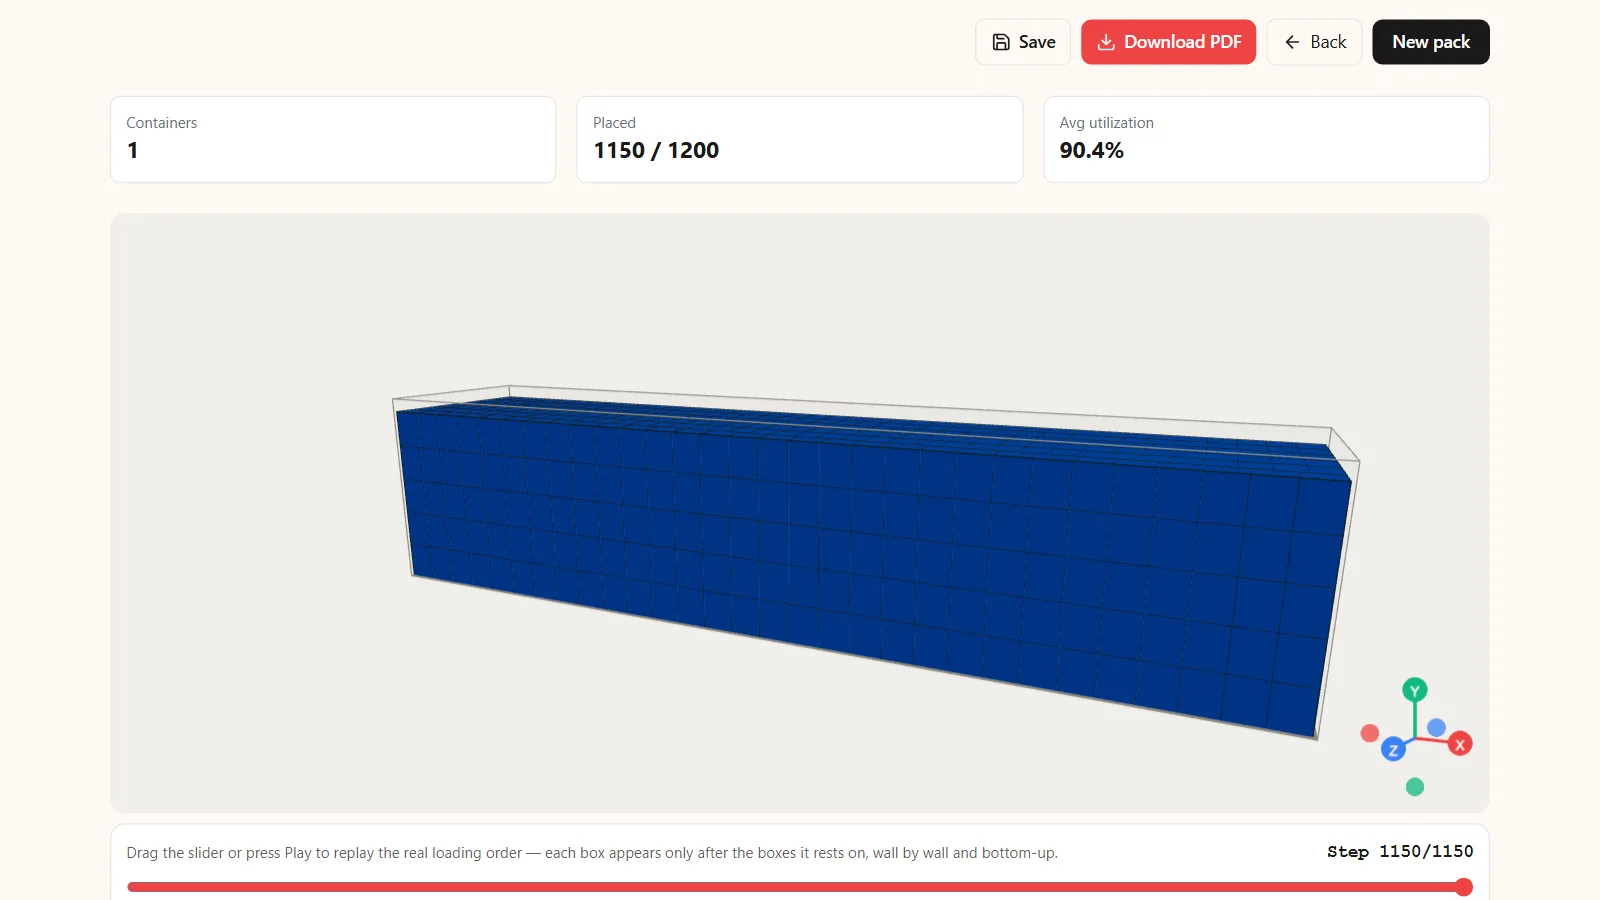
| 50 × 40 × 30 carton | 0.060 m³ | 90.4% |
| 80 × 60 × 50 carton | 0.240 m³ | 89.7% |
| 60 × 40 × 40 carton | 0.096 m³ | 83.1% |
| 120 × 80 × 60 carton | 0.576 m³ | 83.1% |
| 30 × 30 × 30 cube | 0.027 m³ | 79.3% |
| 40 × 40 × 40 cube | 0.064 m³ | 75.5% |
One 40 HC (76.3 m³ inside) loaded to capacity, 1 kg per carton, rotation allowed, Kubova packing engine, measured 2026-06-08. For the mixed profile the engine could draw on more cartons of each size than fit, so it chose the mix.
97.0% — best single carton (40×30×25 cm)
93.1% — a well-mixed 3-SKU load
75.5% — a 40 cm cube, the worst profile
The seven single-carton profiles average 85.4% (median 83.1%). So a light single-SKU load in the mid-80s is ordinary, the high-80s and above is good, and the low-90s and above means the carton suits the container unusually well.
One correction to a common belief: mixing is not automatically the top of the table. The small, well-proportioned 40×30×25 cm carton beat the mixed load on its own. Mixing helps most when your main carton tiles the container badly; it adds little to a carton that already tiles well.
How to calculate container fill rate
Two numbers, both per container:
- Volume fill rate = total outer volume of the cartons loaded ÷ inner volume of the container × 100.
- Weight use = total gross weight of the cargo ÷ the container's payload × 100.
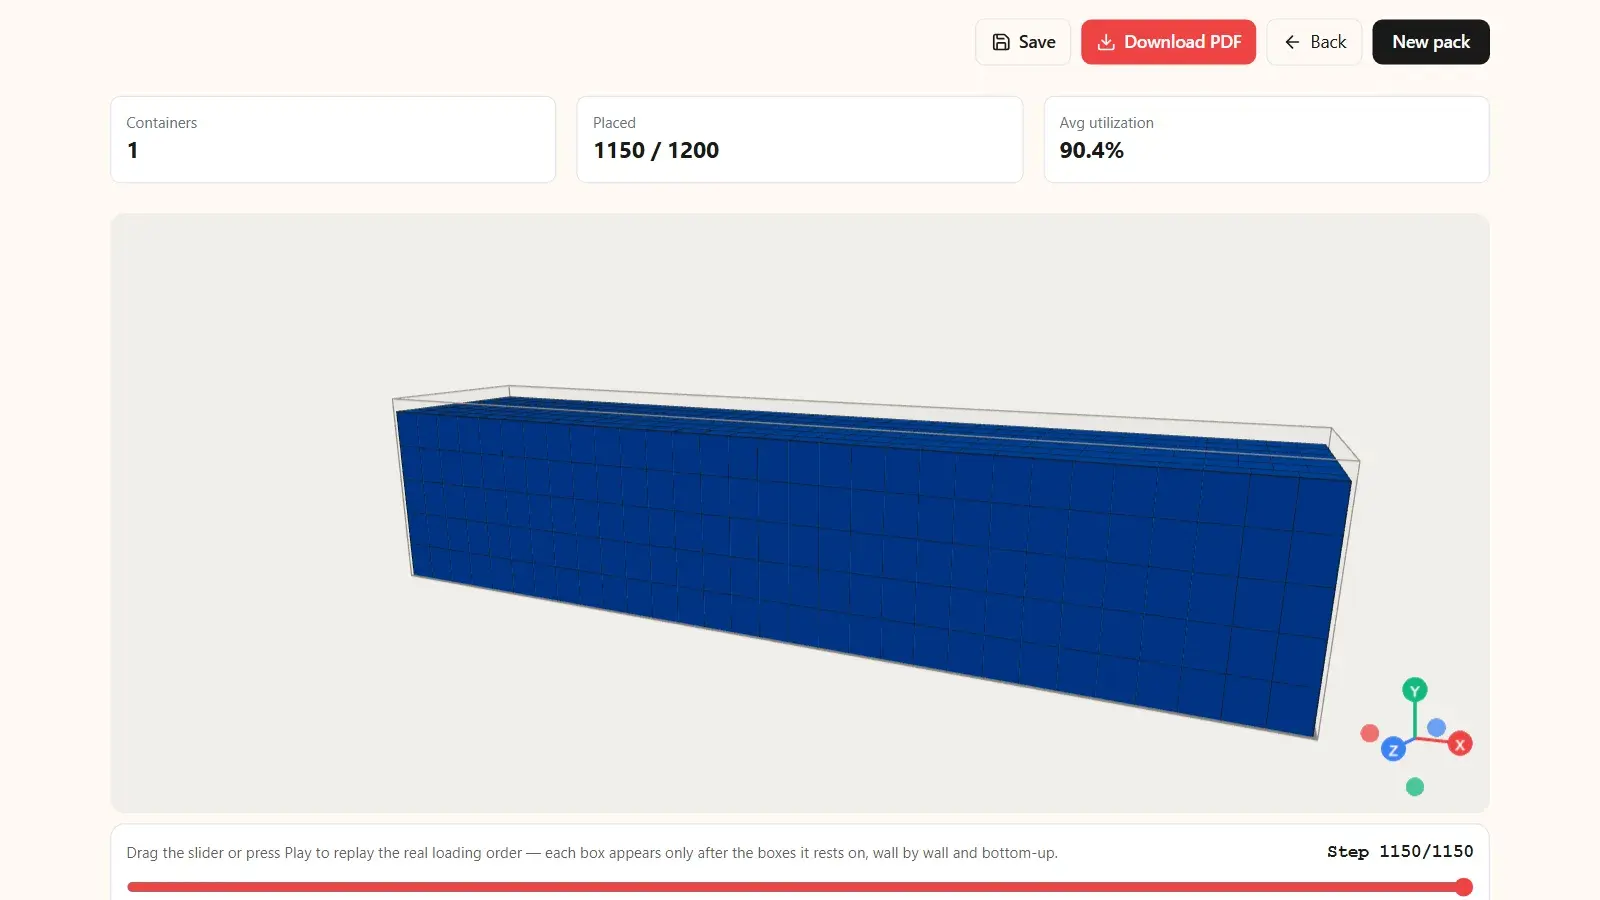
Illustrative example: 1,150 cartons of 50×40×30 cm in a 40 HC. Each carton is 0.5 × 0.4 × 0.3 = 0.06 m³, so the load is 69.0 m³. Divided by 76.3 m³ inside, that is 90.4%, the measured benchmark above. At 6 kg per carton the cargo weighs 6,900 kg, which is 24.1% of a 28,620 kg payload. Report both: the first says how well the space was used, the second says whether weight could ever have been the limit.
The denominator decides the answer. If you divided the same 69.0 m³ by the 40 HC's outside dimensions (40 ft × 8 ft × 9 ft 6 in, about 86.1 m³), you would report 80.2% for exactly the same load. Use the inner volume of the box you actually booked, and if you load on pallets, decide once whether pallet bases count as cargo volume, then stay consistent.
Why the spread is so wide
The 21.5-point gap between the best carton and the worst cube is not noise. It is geometry.
- Tiling remainders. Illustrative hand count: in Kubova's standard 40 HC (1,203.5 × 235.2 × 269.5 cm inside), 40 cm cubes fit 30 along the length, 5 across and 6 high. That is 900 cubes, or 57.6 m³, which is 75.5% of 76.3 m³, the same as the engine's measured fill. The 35.2 cm strip left across the width and the 29.5 cm slab left on top are each too small for another 40 cm cube, and turning a cube changes nothing.
- Proportion, not size. Small cartons usually leave small remainders, which is why the 40×30×25 cm carton reached 97.0%. But size alone does not decide it: the 30 cm cube is smaller still and reached only 79.3%, because its top layer stops 0.5 cm short of a ninth layer (9 × 30 = 270 cm against 269.5 cm).
- Interlocking. In a mixed load, smaller cartons drop into gaps that a larger one leaves, which is why the mixed profile beat every single carton but one.
- Real-world limits on top. The benchmark allowed every orientation and had no stacking limits. Locked orientations ("this side up"), cartons that cannot carry weight on top, and the payload limit all push a real load below these figures.
The single-SKU penalty Loading one product type at a time forfeits the interlocking advantage. If your orders are multi-SKU but your tool only handles one carton, you are benchmarking against the wrong ceiling and likely booking more space than you need. More on this in mixed-SKU container loading.
How to read your own number
| Your volume fill | What it usually means | What to check |
|---|---|---|
| 90% and above | Excellent for light cartons | Little to gain; confirm the plan respects the real inner dimensions |
| 85–90% | Good for most single cartons | Mixing in smaller SKUs from the same lane may add a few points |
| 78–85% | Normal for cubes and cartons that tile badly | Orientation rules, carton proportions, container type |
| Below about 78% | Investigate | A cube-like carton (our 40 cm cube reached 75.5%), weight limit reached first, locked orientations, or a partly empty last container |
| About 100% | Distrust it | Real geometry leaves gaps; look for overflow or volume-only arithmetic |
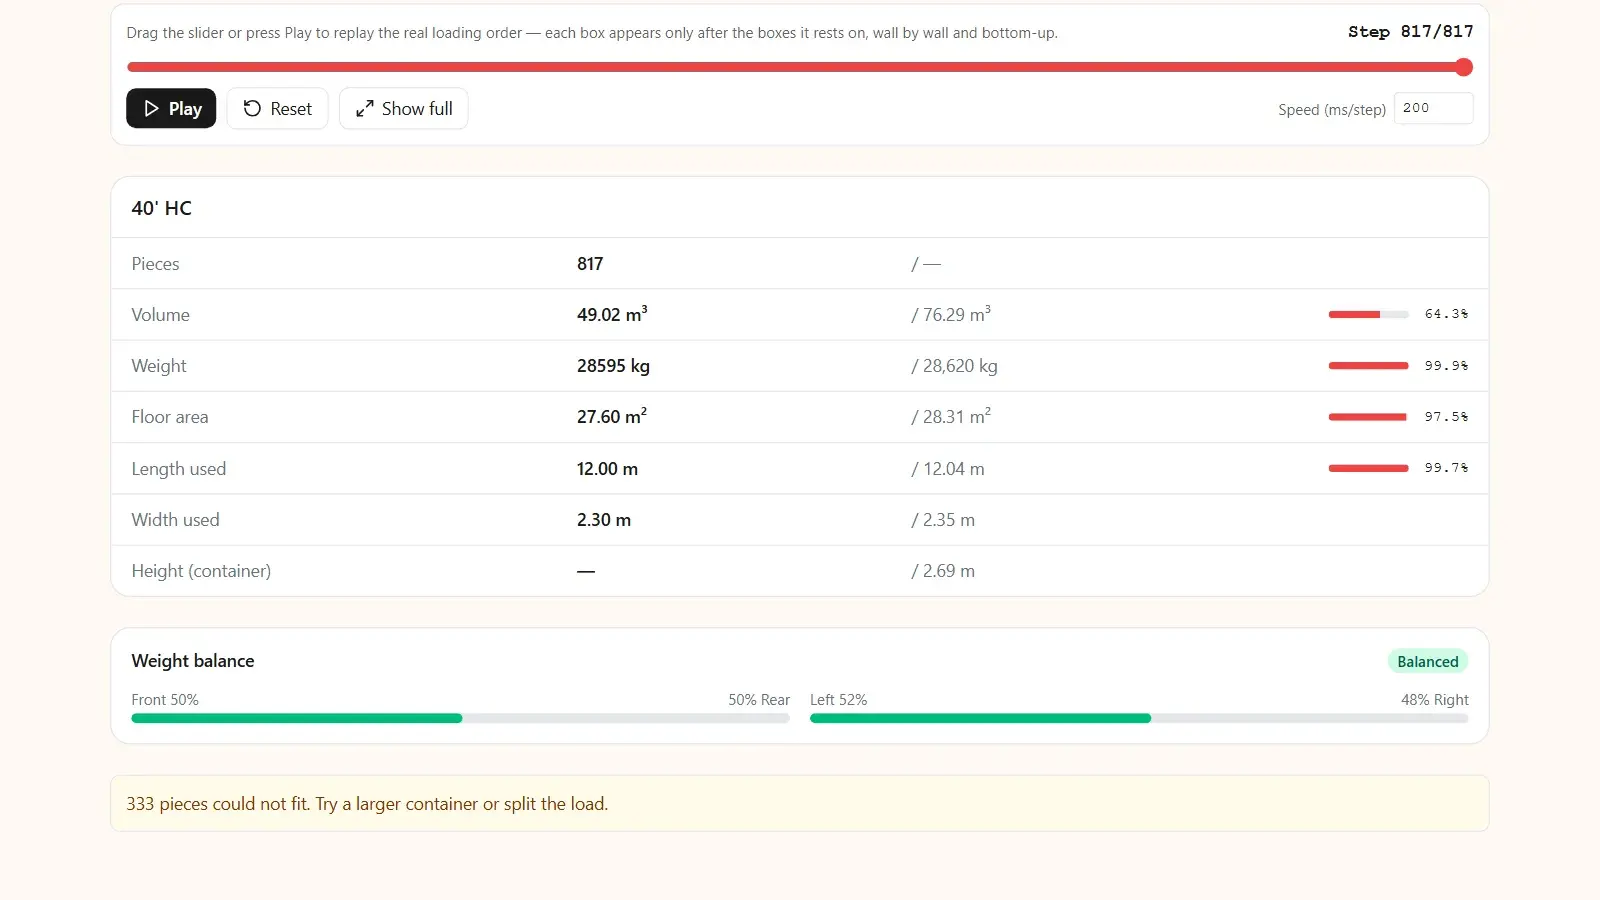
When weight caps you below a 'good' fill On dense cargo you may stop loading at 60% or 75% volume because the payload is used up, and that is correct, not a low score. Illustrative: 50×40×30 cm cartons at 30 kg each reach the 28,620 kg payload of a 40 HC after 954 cartons, which is 57.2 m³ or 75.0% of the space. Weight use is 100%, so the container is full. The method for finding which limit binds first is in volume vs weight: which limit hits first, and 20ft vs 40ft: which container to choose shows why dense cargo often suits a smaller box.
Multi-container shipments: read each container separately
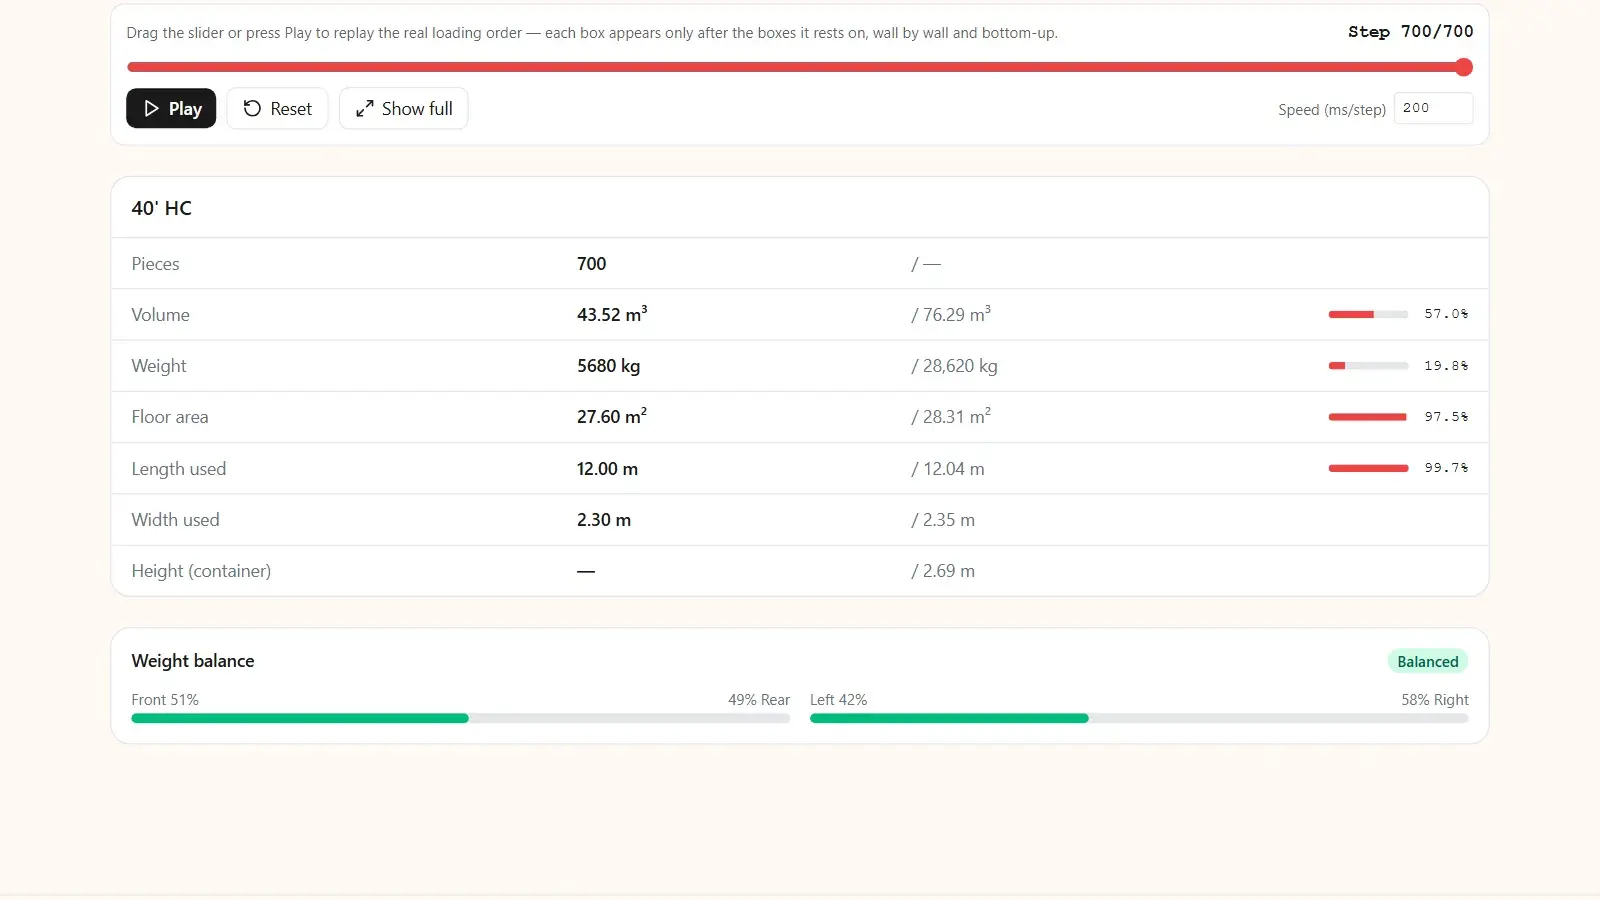
An average across containers hides the one fact you need. Illustrative example: container 1 is loaded at 90.4%, container 2 at 16.6%, which is the average fill we measured for spill-over second containers. The shipment average is 53.5%, which suggests a poor plan. In reality the first container is excellent and the second is mostly air, and the useful action is to consolidate or trim the overflow, not to re-pack the first box. See when you can avoid a second container.
Steps to raise your container fill rate
- Measure real carton sizes, including bulge, and compute fill on the inner volume of the box you book.
- Check weight use first. If it is close to 100%, stop: the fill rate is correct for this cargo.
- Allow rotation wherever the packaging permits, but respect handling marks. The CTU Code tells packers to observe marks such as "this side up", so treat them as fixed.
- Load SKUs that travel on the same lane together so smaller cartons can fill the gaps of larger ones.
- Compare container types. A High Cube's extra 30.2 cm of height adds a full layer for most carton heights, and the gain is often larger than the 12.6% volume difference suggests (see how many boxes fit in a 40ft container).
- Review carton proportions for products you control. Sides that divide 1,203.5, 235.2 and 269.5 cm with small remainders fill better than cubes.
- Secure what remains. The CTU Code tells packers to fill void spaces when necessary. Gaps left after an honest plan are a securing job for dunnage or bracing, not a planning failure.
Common mistakes in fill-rate reporting
- Dividing by outside volume, which makes every 40 HC load look about 11% worse than it is (90.4% reads as 80.2%).
- Averaging across containers, which hides a nearly empty last container.
- Treating 100% as the target. It is not physically reachable with rigid cartons.
- Reading volume without weight. A 75% fill can be a full container.
- Benchmarking against the wrong profile. A cube load at 79% is normal; a 40×30×25 cm carton at 79% means something is wrong.
- Mixing container types in one comparison. A 40 DC and a 40 HC have different inner heights, so the same carton reaches different fill rates in each.
How Kubova handles this
The fill rates above came from the same engine that runs the 3D container loading calculator. Enter each carton's dimensions, weight and quantity, set rotation and stacking rules per item, and choose a 20ft, 40ft or 40 HC container or custom dimensions. Calculate returns in seconds.
Every result shows volume utilization and weight against the payload limit, so you see both halves of the benchmark at once. The figure is what the engine actually achieves inside the real inner dimensions: it never places a box past a container wall and never rounds a result up to look better. If part of the order does not fit, the leftover units are reported. Mixed SKUs are packed together, multi-container plans show each container's use, and the interactive 3D view lets you inspect every box. Download a PDF load plan with 3D views, counts, utilization and weight to share with the warehouse or the forwarder.
To benchmark a repeating set of cartons, the capacity tool shows how many complete sets fit per container and which limit binds. The same calculations are available through the REST API and the MCP server for teams that plan from their own systems (API docs).
Sources & method
- Measured fill rates: Kubova packing engine, measured 2026-06-08, one 40 HC from Kubova's standard catalogue (inner 1,203.5 × 235.2 × 269.5 cm, 76.3 m³), 1 kg per carton, rotation and stacking allowed, loaded to capacity. The mixed profile offered 2,000 cartons of each size and the engine chose the mix. The 16.6% spill-over figure is the average of five measured second containers from the same benchmark (60×40×40 cm cartons at 5 kg, orders sized to spill just past one 40 HC).
- Illustrative figures: the cube hand count, the 6 kg and 30 kg weight examples, the outside-volume comparison and the two-container average are arithmetic, labelled illustrative, not engine output.
- Container dimensions: ISO 668:2020 sets external dimensions and ratings for series 1 freight containers and only minimum internal dimensions for certain types; internal dimensions are specified in the relevant part of ISO 1496 (ISO 1496-1:2013 for general-purpose containers). Inner volumes and payloads here are typical catalogue values; confirm against your carrier's spec sheet.
- Packing practice: IMO/ILO/UNECE CTU Code (full text: MSC.1/Circ.1497), chapter 3: observe handling marks such as "this side up", do not exceed the permitted payload, and fill void spaces when necessary.